In all 50 States, the District of Columbia, and Puerto Rico, it is illegal to drive with a blood alcohol concentration (BAC ) of .08 g/dL or higher. Any fatal crash involving a driver with a BAC of .08 g/dL or higher is considered an alcohol-impaired-driving crash.

Since 1982, drunk driving fatalities have declined by 65 percent through stricter laws and protocol, increased awareness, safety and prevention organizations and new technology. And yet, the threat of drunk driving remains as prevalent as ever. Drunk driving is responsible for killing 10,000 deaths every year. In 2019, it stole the lives of 10,142 people, and every single death could have been prevented.

According to the National Highway Traffic Safety Administration (NHTSA):

  • One person in the U.S. will die every 52 minutes from a drunk driving crash – or 28 people every day.
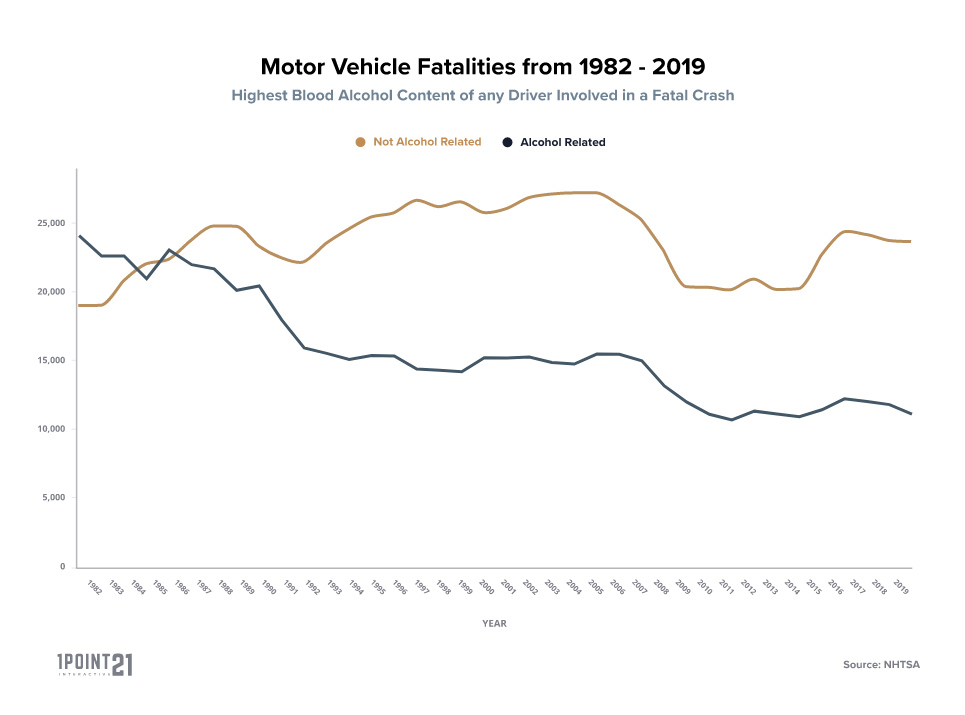
  • About one third of all traffic-related fatalities involve drunk drivers.
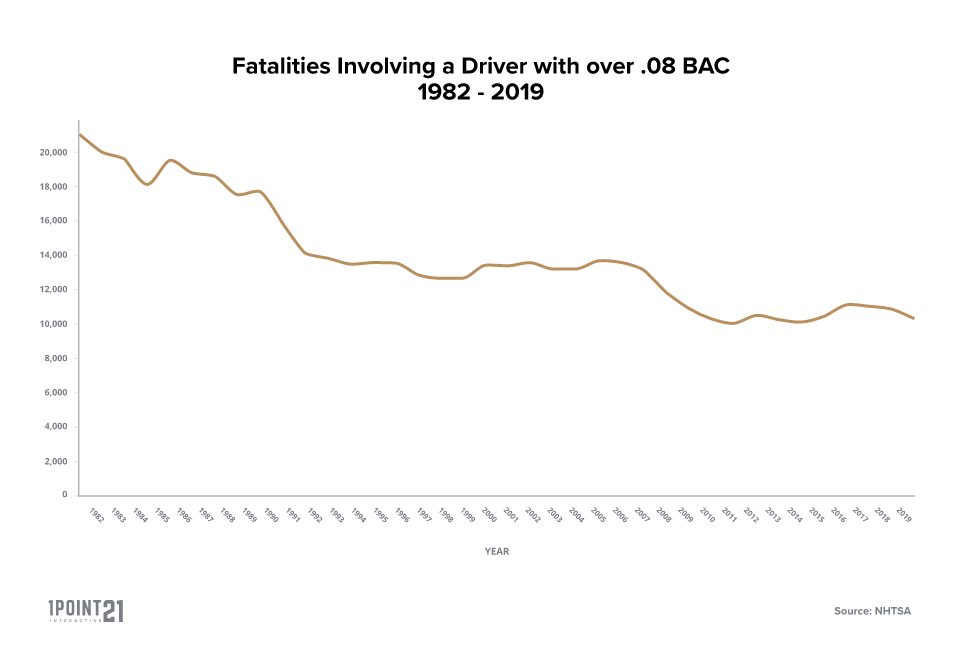
  • From 2010-2019, about 10,000 people were killed every year in drunk driving crashes. In 2019, 10,142 people lost their lives to drunk driving crashes – even though driving while intoxicated is illegal in every state.
  • On average, two out of three people will be involved in a drunk driving crash in their lifetime.
One person in the U.S. will die every 52 minutes from a drunk driving crash – or 28 people every day.

According to Mothers Against Drunk Driving (MADD):

  • In 2013, 28.7 million people admitted to driving under the influence of alcohol; that’s more than the population of Texas.
How Has Drunk Driving Changed Overtime?
drunk driving fatalities

The NHTSA began recording alcohol-related statistics in 1982. From 1982 to 2018:

  • The rate of total alcohol-impaired driving fatalities per 100,000 population declined by 65 percent (from 9.1 to 3.2).
  • The rate of alcohol-impaired driving fatalities for ages 21 and under per 100,000 population declined by 84 percent (from 6.9 to 1.1).
  • Total alcohol-impaired for driving fatalities declined by 50 percent (from 21,113 to 10,511).
  • Drunk driving fatalities involving individuals aged 21 and under declined by 81 percent (from 5,215 to 980).
When Does Drunk Driving Occur the Most?
drunk driving and holidays

According to 2015-2019 fatal crash data from the NHTSA:

  • The three most dangerous days in the year for drunk driving fatalities are holidays or the day after a holiday: New Year’s Day, The Fourth of July and the day after St. Patrick’s Day.

month of the year

  • In 2018, more fatal crashes involved drunk driving in the summer months: in June (9.3 percent), July (9.2 percent), and May (9.1 percent).
    Note: The period between Memorial Day and Labor Day is known as the “100 Deadliest Days of Summer” because the average number of fatal crashes involving teenagers skyrocket.

time of day

  • The most dangerous time of the day isn’t during the day. In 2019, 55 percent of fatal crashes during the hours of 12 a.m. to 3 a.m are alcohol related.
  • The rate of alcohol involvement in fatal crashes was 3.4 times higher at night than during the day.
  • As expected, the majority of fatal crashes for drunk driving did occur in the dark. 69 percent happened in the dark, 27 percent in daylight, three percent at dusk, and one percent at dawn.

day of the week

  • In 2018, twice as many drivers were alcohol-impaired over the weekend than during the week (14 percent during the week compared to 28 percent on weekends).

weather conditions

  • Surprisingly, most drunk driving crashes do not occur in bad weather conditions. In 2018, 89 percent of alcohol-related fatal crashes occurred in clear/cloudy conditions, eight percent in rainy conditions, and three percent in other conditions.
Where Are Drunk Driving Crashes Most Likely to Occur?

According to NHTSA, in 2018:

  • 56 percent of alcohol-related fatal crashes occurred in urban areas, and 44 percent in rural areas.
  • 87 percent of drunk driving crashes occurred on non-interstate roads, while 13 percent were on interstate roads.
drunk driving fatal crashes occur
most crashes occur
Who Is Most Likely to Be a Driver?

According to NHTSA, in 2018:

  • Interestingly, in 2018, the highest percentage of drivers with BACs of .08 g/dL or higher in fatal crashes were motorcyclists. According to the NHTSA:
    • 25 percent of drunk drivers were motorcycle riders
    • 21 percent drove passenger cars
    • 19 percent drove light trucks
    • 3 percent drove large trucks
  • In 2018, there was one female alcohol-impaired driver for every four male alcohol-impaired drivers – 1,918 compared to 7,698.
Drunk Driving by Ethnicity
  • The NHTSA conducted a special report on ethnicity and impaired driving, and found that Native Americans and Whites are consistently at higher risks of impaired driving, while Asians are the least likely. According to the report, the picture isn’t as clear with Hispanics and African American Drivers.
    • This makes sense since alcohol abstinence tends to be more common within Asian populations and less common within Native American communities.
  • Another survey found that self-reported rates of driving under the influence were, indeed, the highest for white men (22 percent), followed by Native American/Native Alaskan men (20.8 percent) and men of mixed races (22.5 percent).
Drunk Driving by Age

According to the NHTSA:

  • In 2018, ages 21 to 24 had the highest percentage of drivers with BACs of .08 g/dL or higher in fatal crashes, making up 27 percent. The age group 25 to 34 made up 26 percent of drunk drivers in fatal crashes.
Underage Drinking and Driving

According to MADD:

  • Approximately 25 percent of motor vehicle crashes with teenagers involve an underage drinker.
  • 95 percent of the 14 million people who are dependent on alcohol started drinking before the age of 21.
  • When kids start drinking at a young age, they are seven times more likely to be in an alcohol-related crash than kids who do not.
Approximately 25 percent of motor vehicle crashes with teenagers involve an underage drinker.
Tips for Spotting A Drunk Driver

If you notice the following signs, get to a safe location as soon as you can and report the potential drunk driver to the police. If something doesn’t feel right while you are on the road, trust your instinct and prioritize your safety.

A drunk drive will most likely:

  • Drive too fast or too slow
  • Lack the ability to stay in one lane
  • Weave in and out of traffic
  • Forget to use turn signals
  • Tailgate
  • Lack control over brakes
  • Stop suddenly or without reason
  • Drive the wrong way on the road
  • Drive without headlights
  • Run stop lights or traffic signals
Drunk Driving By State

In which state do drunk driving crashes occur the most?

From 2015-2019, Montana had both the highest percentage and highest rate of drunk driving fatal crashes per 100,000 people, while New York had the lowest in both. Texas is infamously known as one of the most dangerous states for drunk driving; however, drunk driving fatal crashes made up 25 percent of the total crashes, compared to Montana’s 44 percent.

Which states have the highest rate of alcohol-related fatal crashes?

From 2015-2019, these ten states had the highest percentage of alcohol-related fatal crashes. In these ten states, drunk driving fatal crashes made up one-third or more of their total crashes.

Chart for ten worst states for fatal crashes

From 2015-2019, the following ten states had the highest number of fatal drunk driving crashes per 100,000 people.

  1. Montana – 7.28
  2. Wyoming – 6.25
  3. South Carolina – 5.72
  4. North Dakota – 5.59
  5. Louisiana – 4.76
  6. New Mexico – 4.56
  7. South Dakota – 4.30
  8. Delaware – 4.25
  9. Arkansas – 4.08
  10. Alabama – 4.07

Which states have the highest percentage of drunk driving fatal crashes?

From 2015-2019, these ten states had the highest percentage of alcohol-related fatal crashes. In these ten states, drunk driving fatal crashes made up one-third or more of their total crashes.

  1. Montana – 44 percent
  2. North Dakota – 42 percent
  3. Rhode Island – 41 percent
  4. Alaska – 38 percent
  5. South Dakota – 36 percent
  6. Wisconsin – 35 percent
  7. Vermont – 34 percent
  8. Maine – 34 percent
  9. Colorado – 33 percent
  10. Wyoming – 33 percent
10 lowest state rates
Alcohol Truths & Myths:

Does the type of drink matter? Do casual drinks, like beer, affect you less than hard liquor? Is there a way to sober up faster? Does alcohol make you more confident? Will one drink affect my driving?

According to the South Carolina Department of Public Safety

  • Impairment is not determined by the type of drink, but by the amount of alcohol someone is drinking over time. Therefore, the amount of alcohol in a 12-ounce serving of beer, a 4-ounce glass of wine, and 1.25 ounces of 80 proof liquor can have similar effects.
  • Beer, not hard liquor, is the most common drink people consume before they are involved in alcohol-related crashes or stopped for alcohol-impaired driving.
  • There isn’t a faster way to sober up. Alcohol exits through the liver at its own pace – so tricks, like drinking strong coffee, exercising or taking a cold shower to sober up don’t work; only time does the trick.
  • One of the greatest myths of alcohol is that it makes you invincible. Alcohol does not make you more confident, but it creates a false sense of confidence and control – on and off the road. Drivers with a BAC of 0.08 or more are 11 times more at risk of getting killed in a single-vehicle crash than drivers who are sober.
  • While there are many aspects that play a role in how alcohol impairs your judgment (from weight, size, gender, tolerance to alcohol and ethnicity), it is important to understand that even one drink can affect your driving ability.
How Alcohol Affects Your Brain

Northwestern Medicine lists out the seven different stages of alcohol intoxication and how in each stage, your alcohol intake is changing the way your brain processes information.

  1. Subliminal intoxication: This is the first stage of intoxication when a person’s blood alcohol content (BAC) is between 0.01 – 0.05. At this point, you may not appear as if you are drinking, but your judgment, ability to react, and behavior may have changed slightly.
  2. Euphoria: This is considered the “tipsy” stage when your BAC is between 0.03 and 0.12. Your brain is releasing dopamine – the brain’s pleasure chemical – during the early stages of drinking. As a result, you may feel calm and confident, but your reasoning and memory may be impacted.
  3. Excitement: This is the stage of intoxication when a person’s BAC is between 0.09 to 0.25, and he or she is considered legally intoxicated. This amount of alcohol impacts your occipital lobe, temporal lobe and frontal lobe, resulting in the following effects: blurred vision, slurred speech and hearing, and a lack of control. If your parietal lobe is affected, your movements will slow down and be less out of your control. This stage is known for mood swings, impaired judgment, and even nausea or vomiting.
  4. Confusion: At this stage, a person has a BAC from 0.18 to 0.3 and appears disorientated. Your coordination is affected and you may need assistance walking or standing. In addition, this stage may include blackouts, or the temporary loss of consciousness or forgetfulness. You could also injure yourself but not feel the pain to the extent you would without the alcohol in your system.
  5. Stupor: This is when your BAC is 0.25, and you may be at risk of alcohol poisoning. The alcohol has significantly impaired all mental, physical and sensory functions and you may be at a high risk of passing out, suffocating, or injuring yourself.
  6. Coma: Your BAC is 0.35. Everything from your respiration, circulation, motor responses and reflexes are weakened at this point. You are at a risk of going into a coma and also, at risk of death.
  7. Death: At this stage, your BAC is over 0.45. A person is at a high risk of dying from alcohol poisoning or the brain’s failure to control the body’s vital functions.
Drunk Driving Costs and Consequences
  • According to the nonprofit Pacific Institute for Research and Evaluation, drunk driving costs the U.S. an estimated $132 billion per year, and this affects not only the person who is committing the crime, but the country as a whole. It increases insurance rates, taxes, medical and property costs, and human cost.
    • In addition, the organization found that a first-time offender with a DUI could be charged up to $15,000, pay as much as $6,000 in increased insurance premiums, $2,000 for an interlocking ignition device, and more than $1,000 each for fines, remedial education, relicensing, and legal fees.
231 children – or 22 percent – were killed in alcohol-impaired-driving crashes.
  • In 2018, 1,038 children 14 and younger were killed in motor vehicle traffic crashes in 2018. Out of that, 231 children – or 22 percent – were killed in alcohol-impaired-driving crashes.
    • 55 percent of the children killed were passengers of vehicles with drivers with BACs of .08 g/dL or higher
    • 31 percent were passengers in other vehicles
    • 13 percent were nonoccupants, such as pedestrians
child killed in alcohol-imparied-driving crashes
Drunk Driving Convictions and Arrests
  • According to the NHTSA, on average 1.5 million people are arrested annually for driving under the influence of alcohol or drugs – or one out of 121 licensed drivers.
  • According to the Federal Bureau of Investigation, about 1,024,508 drivers were arrested for driving under the influence of alcohol or narcotics in 2019. This would end up being approximately one arrest for every 222 licensed drivers in the U.S.

According to MADD:

  • 50 to 75 percent of convicted drunk drivers continue to drive on a suspended license.
  • Every day, people drive drunk more than 300,000 times, but only about 3,200 are arrested.
  • An average drunk driver drives drunk over 80 times before his or her first arrest.

How many convicted of drunk driving are repeat offenders?

Nearly one-third of all drunk driving crashes were caused by repeat offenders. While most drunk driving crashes are not caused by repeat offenders, they are more likely to involve a repeat offender than a driver without a prior conviction.

  • 29 percent of convicted drunk drivers were repeat offenders.
  • According to a federal study, drivers convicted of drunk driving during the past three years are 1.8 times more likely to be involved in a fatal crash as drivers with no prior conviction and four times as likely in fatal crashes, where drivers have BACs of 0.10 or higher.
    Note: Note that alcohol offenses are not always included on driver records, as some court programs permit drivers to remove or avoid conviction in lieu of an educational program. So, the actual number of offenses may be higher.

Who is likely to be arrested?

  • According to MADD, in 2017, three times as many males were arrested for alcohol-impaired driving than females – 569,148 compared to 195,421.
Safety and Prevention: What Really Works?
Alcohol-Impaired Driving Laws
  • NHTSA estimates that minimum-drinking-age laws have prevented 31,959 deaths from 1975 to 2017.
Cumulative Lives Saved by Minimum Drinking Age Laws

Organizations Fighting Against Drunk Driving

  • Mothers Against Drunk Driving (MADD) reports that since it was founded in 1980, it has helped lower the number of drunk driving deaths by half – saving 350,000 lives, and assisting more than 850,000 victims.
  • The Foundation for Advancing Alcohol Responsibility (Responsibility.org) reports that since it was founded in 1991, drunk driving fatalities have declined by 36 percent, teenagers self-reporting alcohol consumption has declined from 80 percent to 44 percent, and youth binge drinking has reduced by 50 percent. According to the organization, 87 percent of American adults self-report that they are “confident they drink responsibly.”
  • Students Against Destructive Decisions (SADD) is the nation’s largest peer-led organization. Studies show that schools with an established chapter have an increased awareness of the dangers of underage drinking, drug use, and driving under the influence.

Safety Campaigns

  • In 1983, NHTSA began the campaign, “Friends Don’t Lead Friends Drive Drunk.” Surveys show that the campaign was effective and that seven out of every ten Americans have attempted to stop another person from driving after drinking at some point since it was launched.
  • In 2017, the Texas Department of Transportation began the campaign, “Plan While You Can,” which encourages people to plan their ride home before they start drinking and celebrating. It was also targeted towards students before spring break or the holiday season – a reminder that if you choose to drink, to do so responsibly.

Ignition Interlocks

All 50 states require repeat offenders to install ignition interlocks – or small handheld car breathalyzers – after a DUI, though the circumstances of when it’s required vary by state. According to MADD, ignition interlocks have prevented more than three million drivers from attempting drunk driving in 12 years.

  • In 2005, New Mexico became the first state to require all offenders convicted of drunk driving to install ignition interlocks. As of now, 34 states have passed all-offender laws for interlocks.
  • One study found that states requiring all drunk-driving offenders to install ignition interlocks had a 15 percent decrease in drunk-driving fatalities. However, there is some controversy around the devices and their safety and accuracy, as they don’t always give drivers the time to pull over safely during the “rolling retests,” or checks that occur randomly while driving.
  • Not only are ignition interlock devices saving lives, but they are saving money, too. According to the NHTSA, the public saves three to seven dollars for every one dollar that is spent on ignition interlock devices for offenders.

Sobriety Checkpoints

  • Evidence shows that sobriety checkpoints that are publicized, highly visible, and frequent reduce impaired driving fatal crashes by 18 to 24 percent in the U.S.